

What comes to mind when you hear the phrase “solar storm”? A scene from a sci-fi blockbuster? A cataclysm in a fantasy novel? The truth is less fictional, and far more unsettling. Solar storms aren’t just a fantastical concept, they are real, and they strike more often than you might imagine.
Many solar storms, also known as geomagnetic disturbances, are weak – either too weak to affect us, or they dissipate before reaching Earth. But this isn’t always the case. Throughout history, there have been multiple instances of solar storms wreaking havoc on technology and infrastructure around the globe. And there’s no reason to think it won’t happen again.
So what would actually happen if a powerful solar storm struck Earth, one strong enough to impact our daily lives? Are we ready? The challenge is clear: predict the storm’s impact on critical systems, and reduce the risks to ourselves and our infrastructure before the next one arrives.
How do Solar Storms Work?
Firstly, a solar storm is nothing like a regular storm of rain, wind, or hail. Instead, it originates from the Sun itself, driven by solar radiation as part of its roughly 11-year solar cycle. The Earth is bathed in solar radiation every day, and for the most part, our atmosphere shields us. But solar storms are different. They are bursts of radiation far stronger than the background levels we normally experience.
These bursts often coincide with solar flares, which are immense explosions of electromagnetic energy that erupt from the Sun’s surface. Solar flares typically occur above giant sunspots, areas of intense magnetic activity that can span tens of thousands of kilometers. Another solar phenomenon, Coronal Mass Ejections (CMEs), can also be linked to sunspots. Unlike solar flares, CMEs travel more slowly, yet they carry charged particles capable of reaching Earth’s surface, sometimes with dramatic consequences.
But how exactly do these solar particles make their journey to our planet? The answer lies in solar wind. One that consists of a stream of high-speed charged particles, protons and electrons, propelled outward from the Sun. Solar wind also drags the Sun’s magnetic field along with it, and when this magnetic torrent encounters Earth’s own magnetosphere, it can trigger geomagnetic storms: the very solar storms that disrupt technology and power systems. To read more into solar wind and its dynamics, we recommend reading this short article from NASA.
Beautiful in Space, Dangerous on Earth
The effects these solar winds have on Earth’s infrastructure are subtle but profound. Geomagnetically Induced Currents (GICs) arise when Earth’s magnetic field interacts with the shifting magnetic fields brought by a geomagnetic storm. During intense solar activity, these currents can surge through the planet’s conductive crust and near-surface materials. The phenomenon is explained by Faraday’s law of electromagnetic induction, which dictates that a changing magnetic field will induce an electric field in a conductor. In practical terms, the Sun’s activity can directly induce electrical currents here on Earth, potentially affecting power grids, pipelines, and other critical systems. Below shows a simplistic example of how induced currents are caused due to a fluctuating external magnetic field:
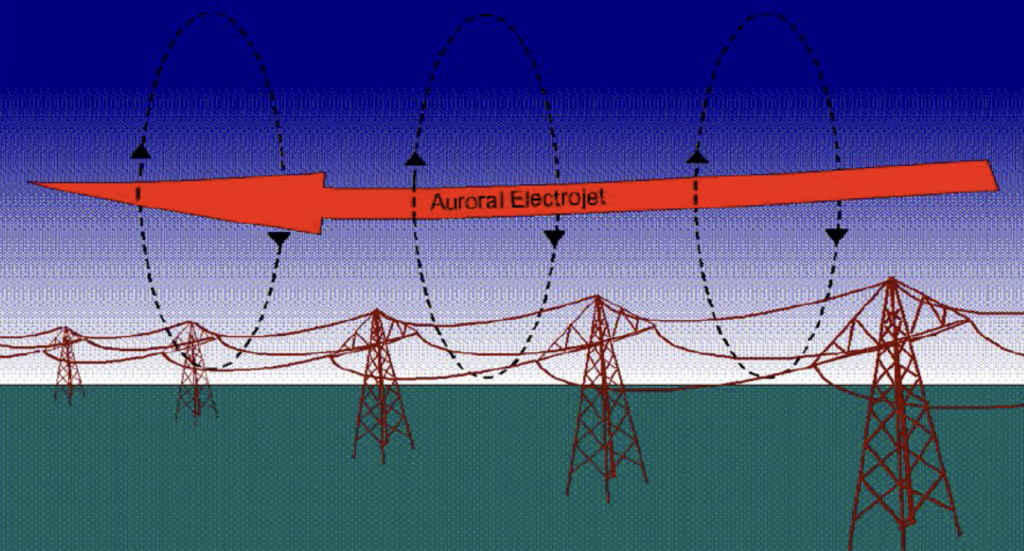
Figure 1: Example of Faraday’s law in action. Magnetic fluctuations caused by increased solar activity induce an electric current, which flows through the path of least resistance. Here, this is the transmission line. Credit: British Antarctic Survey
So, unless you (unusually) suffer from electromagnetic hypersensitivity, why should an electric field worry you? The problem lies in where these induced electric fields go: they follow the path of least resistance. That often means power grids and pipelines, where currents can circulate across vast distances, sometimes affecting entire regions. In power grids, these currents can overload transformers, causing overheating, internal failures, and, in extreme cases, widespread blackouts. The effect is even more pronounced in areas with highly resistive soils, where the currents (GICs) cannot safely dissipate into the ground.
Just as wind and rain signal a storm outside, a power outage can be a warning of a solar storm at work. That’s why monitoring and predicting geomagnetic disturbances is crucial, both to gauge the risk of GICs and to put safeguards in place to protect critical infrastructure before trouble strikes from space.
From Solar Wind to Power Grid Protection
How do we go from solar wind to mitigating the risk of a GIC on the power grid? It’s a multi-step process that relies on a lot of data. We must trace the journey from solar activity to disturbances in Earth’s magnetic field, then analyse the induced electric fields that give rise to GICs. Like a geomagnetic storm itself, we’ll begin at the source: by looking at solar wind data.
This data is collected by two NASA-hosted satellites positioned at the L1 Lagrange point: the Advanced Composition Explorer (ACE) and the Deep Space Climate Observatory (DSCOVR). Both measure a range of parameters in the solar wind, but for our purposes, seven are key:
The first is Field Magnitude Average, which represents the average magnitude of the Interplanetary Magnetic Field (IMF) over a given period. The IMF, extending from the Sun throughout the Solar System, fluctuates with the Sun’s rotation and activity, including solar flares and sunspots. The IMF itself is a vector of three underlying axis components: Bx, By, and Bz, which typically range between -10 nT and +10 nT (nano-teslas).
During intense solar activity, such as events that trigger potential geomagnetic storms, these values spike dramatically. The Bz component is highly significant for driving geomagnetic activity, with a negative (“southward”) orientation creating the strongest coupling to Earth’s magnetic field, and increasing geomagnetic activity.
The final three parameters are the speed, density, and temperature of protons in the solar wind. All three are shaped by the Sun’s magnetic field and activity, and all rise sharply during major events like CMEs. In short, increases across any of these seven solar wind parameters signal intense solar activity capable of disturbing Earth’s magnetic field. For a deep-dive into additional solar wind parameters from the two spacecraft, give NOAA a visit!
But how exactly does this activity translate into changes in our planet’s magnetic environment, and how do we measure it?
Measuring Earth’s Magnetic Field
Across the world, a network of organisations and agencies collaborates to monitor variations in Earth’s magnetic field. This global initiative, known as SuperMAG, uses magnetometers, instruments that record the minute fluctuations in magnetic strength, to study geomagnetic phenomena such as aurorae, solar storms, and the interaction between solar wind and the magnetosphere.
When the solar wind collides with Earth’s magnetosphere, it compresses the magnetic field on the dayside and stretches it into a long tail on the nightside. This interaction not only induces electric fields but can even cause compass needles to drift. In short, Earth’s magnetic field can change – and sometimes quite dramatically. Magnetometers capture these variations in real time.
In the UK, there are three public magnetometer stations: Eskdalemuir and Lerwick in Scotland, and Hartland in south-west England. Each station monitors minute-by-minute changes in the local magnetic field. On most days, their readings are steady and unremarkable. But during a geomagnetic storm, the data tells a very different story: showing rapid, sometimes violent fluctuations. The larger the variation, the more severe the storm. Changes exceeding 50 nano-teslas (nT) generally indicate an active storm. A great way to see observe geomagnetic activity in real time is to visit The British Geological Survey’s website, where they monitor and report the UK’s magnetic field daily.

Figure 2: Map of the UK with gold stars showing the location of the three magnetic stations. Two are in Scotland; in Eskdalemuir and Lerwick, and one in the south west of England, in Hartland.
To classify storm severity, scientists use a logarithmic scale known as the K-index, ranging from 0 to 9. The higher the K-index, the more extreme the disturbance—and magnetic field shifts during major storms can far exceed the 50 nT threshold.
Each magnetometer station records a unique baseline magnetic field, determined largely by its location. Latitude plays a key role: near the magnetic poles, field lines are nearly vertical, while near the equator, they lie horizontally. The figure below shows Earth’s magnetic field coloured by intensity along with the locations of the SuperMAG stations, showing the strongest field magnitude at the North pole. This means disturbances in Earth’s magnetic field are stronger at higher latitudes, which explains why northern regions, including parts of Scotland, experience more intense geomagnetic activity than areas farther south, and why you’re more likely to see the Northern lights in Scotland and Nordic countries.

Figure 3: Magnetic field intensity map of the Earth. The magnitude of the magnetic field is largest at the Earth’s poles, and at its maximum at high latitudes. Black triangles denote the roughly 350 SuperMAG ground magnetometer stations across the globe.
During a powerful storm, the magnetic field can fluctuate dramatically. The most recent severe storm occurred in early September 2017, for which the Lerwick magnetic station in Scotland observed an extreme magnetic field fluctuation of 598nT (left) over an eight hour period between the 7th and 8th, indicative of a severe storm. This is highly contrastive to the following days post-storm (right) showing a typical quiet day at Lerwick, where the magnetic field remains stable around its baseline.
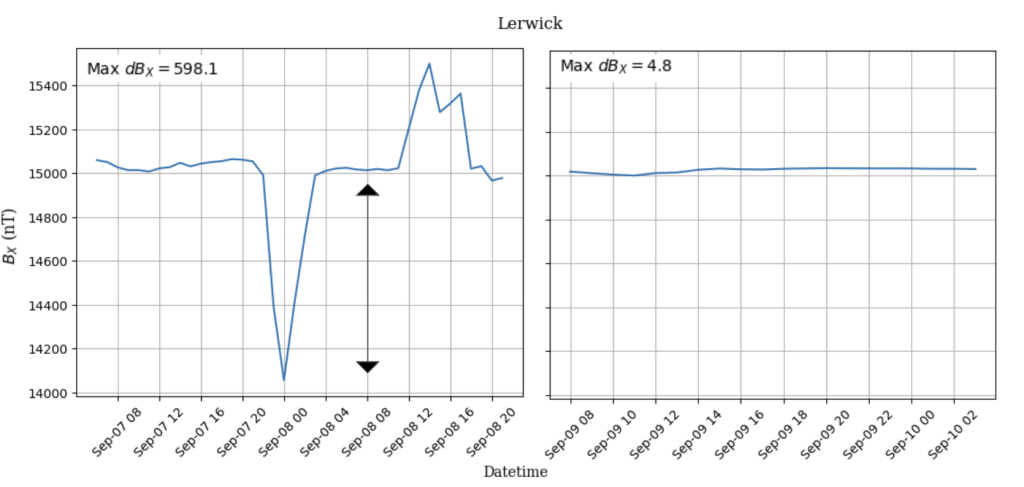
Figure 4: Horizontal magnetic field (Bx) time series for the Lerwick magnetometer station over the period of the September 2017 solar storm.
Right: Bx time series for the period of the storm from 7th-8th September. The arrow denotes the maximum field fluctuation corresponding to an extreme field change of nearly 600nT, shown in the top left corner.
Left: Bx time series the days following the storm, from 9th-10th September. The largest field fluctuation, shown in the top left, is under 5nT, which is the typical daily fluctuation for a stable magnetic field.
Not convinced that solar wind is the main driver of geomagnetic storms? Take a look at these seven solar wind parameters from the September 2017 storm. Each shows dramatic fluctuations as the storm hit Earth:
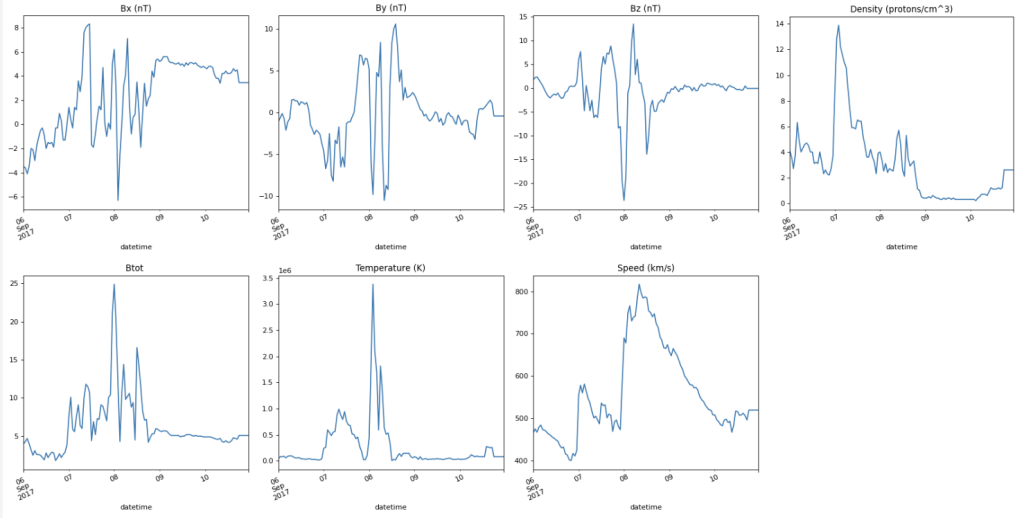
Figure 5: The seven solar wind parameters measured by the ACE satellite over the period of the September 2017 storm.
Top: Left to right shows the fluctuations in the interplanetary magnetic field components Bx, By, and Bz (in nT), and the density of protons in the solar wind, measured in protons per cm2. Note how the fluctuations in the Bz component are drastic, far exceeding the +10/-10nT stable range.
Bottom: Left to right shows the magnetic field magnitude, Btot, and the temperature (in Kelvin) and speed (in km/s) of the solar wind. All seven parameters fluctuate dramatically at the time of the extreme storm impact on Earth, on 8th September.
Solar Storms Decoded: What We’ve Learned So Far
So far, we’ve uncovered the hidden drama of solar storms: the journey of solar wind from the Sun, the way it twists and shakes Earth’s magnetic field, and why those invisible forces can trigger currents that threaten our power grids. We’ve explored the data that makes all of this measurable – from satellites in space to magnetometers on the ground – and seen just how dynamic and complex our planet’s magnetic environment really is.
But this is only the first chapter. Understanding the storm is one thing; predicting its impact and taking action is another.
Stay tuned for Part II, where we’ll explain how to turn that understanding into predictions, calculate the electric fields, and see what it means for the UK’s power grid…


